Data analytics services that turn raw data into decisions.

We build the data layer behind live products - ingestion, warehousing, transformation and the business intelligence dashboard your team opens each morning. Data engineering from the team behind platforms handling $100M+ in annual bookings.

  • EzLicence · $100M+ in annual bookings reported on
  • Fitstop · 100+ gyms, 50,000+ active members
  • AWS Advanced Tier Partner · 15+ engineers
  • Your data, your infrastructure, your IP
$1.5B+Combined client revenue facilitated
100+Products shipped and instrumented
99.99%Uptime across the portfolio
15+AWS-accredited engineers

Three platforms where the numbers had to be right.

Data analytics services are easy to demonstrate and hard to trust, so the only useful evidence is what happened to a business once its numbers became reliable. When EzLicence financial reports would not balance, we replaced report-time reconstruction across a dozen unrelated tables with a canonical double-entry credit ledger covering 18 event types, with real-time capture and idempotent reprocessing. Every liability report now draws from one reconcilable source, finance discrepancy complaints stopped, and outstanding credit is aged into time buckets and categorised by source for cash-flow decisions - on a platform processing $100M+ in annual bookings and 250,000+ lesson hours booked each year. For Fitstop we built the member app and the franchisee operations portal across 100+ gyms and 50,000+ active members, lifting user retention by more than 10 percent. For Move With Us we refactored the user program engine from duplicated per-user data to templates: the core workout table shrank from 42GB to 0.9GB, a 98 percent reduction, and database CPU peaks fell from 40 percent to under 5 percent. Three different problems - a reporting problem, a multi-site visibility problem and a data-modelling problem - and one pattern underneath all of them. Fix the structure the data sits in and the reporting stops being an argument.

Reports that balance by construction.

EzLicence financial reports would not balance. That is a sentence with a great deal hiding behind it, because when reports disagree the immediate cost is not the discrepancy - it is that finance stops trusting every number on the platform, and someone quietly starts keeping a parallel spreadsheet that becomes the real source of truth. The cause was architectural rather than a reporting bug. Outstanding credit was being reconstructed at report time by querying a dozen unrelated tables that had never been designed to be summed together, so the answer depended on the order events happened in and on edge cases nobody had enumerated. We replaced that reconstruction with a canonical double-entry credit ledger covering 18 event types, capturing in real time at the moment each event occurs and supporting idempotent reprocessing, so a historical bug can be fixed by re-running a period rather than lived with forever. Every liability report now draws from one reconcilable source. Finance discrepancy complaints stopped. Outstanding credit is aged into time buckets and categorised by source, which turned a number that used to be disputed into one that informs cash-flow decisions. This is what data engineering services buy you that a dashboard alone cannot: the reports agree because they cannot structurally disagree.

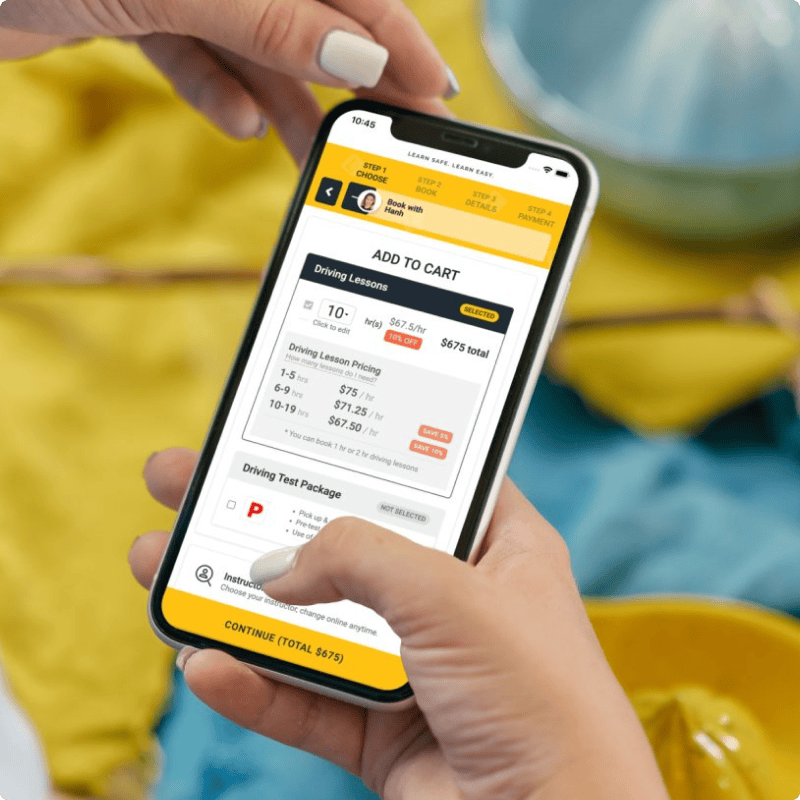
EzLicence marketplace platform built and operated by PixelForce EzLicence booking and reporting experience
Built by PixelForce 18 ledger event types · one reconcilable source

The engineering behind the dashboard.

A dashboard is only as trustworthy as the infrastructure feeding it, which is why the credential that matters most on a data engagement is not a visualisation portfolio. PixelForce is an AWS Advanced Tier Partner with 15+ AWS-accredited engineers, and holds a 99.99 percent uptime rate across 100+ shipped products. Alongside that we hold Apple Best of Developers, Watch and TV App of the Year, Web Excellence Awards for both website and app work, and Top Clutch App Development, Software Development and User Experience Company in Australia. On an analytics platform the uptime figure is not decoration: a pipeline that silently stops running is worse than no pipeline, because a stale dashboard still looks authoritative and people keep making decisions from it. Monitoring that tells you a job failed before a stakeholder tells you the numbers look wrong is a core part of what we build, not an upgrade.

Apple Watch App of the Year
Clutch Top User Experience Company
Apple TV App of the Year
Apple Best of Developers
Clutch Top App Development Company
Clutch Top Software Developers
Australian Technology Services Achiever
Web Excellence Awards (Website)
Web Excellence Awards (App)
ACS Digital Disruptor Gold Award
Clutch Top Android App Development
Clutch Top iPhone App Development

Why businesses choose our data analytics consulting.

Four reasons Australian businesses pick PixelForce for data analytics services rather than a specialist BI consultancy, a reseller with a licensing quota, or an offshore reporting team. Analytics is the category most crowded with impressive demonstrations, because a convincing dashboard can be built in an afternoon on data nobody has validated. What separates a reporting layer that gets used from one that gets quietly abandoned is almost never the charts. It is whether the numbers can be trusted, whether the people who built the pipeline understand the product generating the data, whether anybody keeps improving the thing after launch, and whether you own what was built. Those four are what follow.

We build the products, not just the reports

Most analytics providers arrive after the fact and work from whatever the database happens to contain. We build and operate the platforms generating the data, across 100+ shipped products, which changes what we can offer. When an event was never captured, we can add the instrumentation rather than filing a request with whoever owns the codebase. When a number cannot be computed reliably, we can fix the data model instead of approximating around it - which is exactly what the EzLicence credit ledger and the Move With Us program-engine refactor both were. Analytics and engineering being the same team removes the handoff where most reporting projects lose their accuracy.

  • Product engineering and analytics under one roof
  • Missing instrumentation added, not worked around
  • Data-model fixes available, not just report fixes
  • 100+ shipped products of context behind the numbers

Tool-agnostic, with no licensing quota

We are not a reseller for any warehouse or business intelligence vendor, so the architecture we recommend is not a description of what we are contractually obliged to sell. We work across BigQuery and Snowflake for warehousing, dbt for transformation, third-party ingestion tools such as Stitch and Fivetran at MVP and small scale with custom in-house pipelines once you outgrow them, and Power BI, Looker, Metabase or a fully custom dashboard for presentation. The 1-3-1 method frames the decision: one problem, three options with their honest trade-offs across budget, timeline and scope, and one recommendation. Sometimes that recommendation is that you do not need a warehouse yet.

  • BigQuery, Snowflake, dbt, Stitch, Fivetran
  • Power BI, Looker, Metabase or fully custom
  • No vendor we are obliged to recommend
  • 1-3-1: one problem, three options, one recommendation

Your data stays yours

Client data and intellectual property stay on the client's own infrastructure, on the client's own cloud account. That applies to every engagement we run, data services included, and it is the question worth asking early of any data analytics company, because the answer determines how much leverage a provider has over you later. A reporting platform you cannot move is a reporting platform whose price only goes one direction. On the Custom Build pathway you own the ingestion, warehouse and dashboard outright, with intellectual property transferring on full payment. Nothing about working with us depends on you being unable to leave.

  • Data and IP hosted on your own cloud account
  • Custom Build: you own the whole stack outright
  • IP transfers on full payment
  • No lock-in engineered into the architecture

100% in-house Adelaide team

The people who define your metrics are the people who build the pipelines and ship the dashboard. PixelForce runs 100% in-house development from an Adelaide headquarters, so there is no subcontracting chain between the conversation and the code and no timezone gap turning a definition question into a two-day round trip. That matters more on data work than on most engagements, because metric definitions get refined constantly during a build - the moment a real report appears, someone discovers that the agreed definition of an active user was wrong. Cadence is fixed and visible: squad sessions every 2 weeks, planning every 4 weeks, and sprint demos you attend rather than a status email you interpret.

  • 100% in-house development, Adelaide HQ
  • No subcontracting chain, no timezone gap
  • Squad every 2 weeks, planning every 4 weeks
  • Sprint demos you attend, not a status email

Data analytics services we deliver.

Six data analytics services and data engineering services we ship repeatedly for Australian businesses - from data strategy and metric definition through pipeline development, warehousing and transformation, business intelligence dashboards, product analytics instrumentation, and the Data-as-a-Service subscription that keeps it all running. The underlying architecture repeats across projects: data sources, ingestion, warehouse, raw data, transformation, a metrics layer, then the dashboard. What changes is which commercial question the reporting has to answer and how much of the foundation already exists. Take one service or combine several into a single engagement scoped in Phase 1. Where the work is really about hosting cost, scaling or deployment pipelines rather than reporting, that is a different engagement and it lives on our cloud infrastructure and DevOps page.

Data strategy, scoping and metric definition

Phase 1 Scoping & Design, the mandatory first step of every data build. Preliminaries, then two strategic workshops covering business requirements, the decisions the reporting must support, the architecture direction and the scope of version one. You leave with a Business Requirements Document, an agreed metrics dictionary defining exactly what an active user, a churned subscription or a completed booking means, the target architecture, a Product Requirements Document and a fixed-cost Statement of Work, typically for $35,000 to $65,000. It is a standalone commitment on purpose, so you can stop after it. No Blueprint, no Build.

  • Two strategic workshops and preliminaries
  • Metrics dictionary with agreed definitions
  • Target architecture and source inventory
  • BRD, PRD and a fixed-cost SoW

Data engineering and pipeline development

Data engineering services covering the plumbing beneath everything else: connectors pulling from your backend database, app and website event streams and third-party sources such as Meta, Google, TikTok, HubSpot and Klaviyo, plus the scheduling, orchestration and failure alerting around them. We use third-party ingestion tools including Stitch and Fivetran at MVP and small scale, and build custom in-house pipelines once you outgrow them. Two properties are non-negotiable in what we build: real-time capture at the moment an event occurs, and idempotent reprocessing so a period can be safely re-run. Both are what made the EzLicence credit ledger reconcilable.

  • Connectors for product, event and third-party sources
  • Stitch and Fivetran early, custom pipelines at scale
  • Real-time capture and idempotent reprocessing
  • Orchestration with failure alerting built in

Data warehousing and transformation

Data warehouse services on BigQuery or Snowflake, with transformation modelled in dbt so the business logic is organised into dependencies, tested, version-controlled and reviewable rather than buried in a spreadsheet formula nobody dares change. This is the layer that turns raw ingested tables into a defined metrics layer, and it is where the difference between two dashboards agreeing and two dashboards arguing is settled. Warehouse and tooling costs are billed to you directly by the provider on their own terms and change regularly, so check the current published pricing from BigQuery or Snowflake rather than a figure on an agency page.

  • BigQuery and Snowflake warehousing
  • dbt transformation with tests and version control
  • A defined metrics layer, not ad-hoc queries
  • Historical capture the source systems overwrite

Business intelligence dashboards and reporting

Business intelligence services delivering the layer people actually open, whether that is Power BI consulting on an off-the-shelf tool your team can extend themselves, or custom dashboard development embedded inside your own product with your own authentication and permissions. Off-the-shelf usually wins for internal audiences that want self-service. Custom wins when the reporting is customer-facing or when permissions are genuinely complex - a franchisee should see their own site and the network benchmark and nothing else, which is precisely the shape of the Fitstop operations portal across 100+ gyms. Vendor licensing changes, so check the current Power BI pricing directly.

  • Power BI, Looker and Metabase implementation
  • Custom dashboards embedded in your product
  • Role-based visibility for multi-site operators
  • Data visualisation designed around the decision

Product analytics and event instrumentation

The service for teams whose reporting question is about user behaviour rather than finance: which features are actually used, where onboarding loses people, how cohorts retain over time, and which signals precede churn. It starts with an instrumentation plan defining the events worth capturing and their properties, because the most expensive mistake in product analytics is discovering a year late that the event you now need was never recorded. Data you did not capture is gone. We wire the instrumentation into the product itself, which is straightforward when we built it and entirely possible when we did not.

  • Event taxonomy and instrumentation plan
  • Funnel, activation and onboarding drop-off analysis
  • Cohort retention and churn-signal reporting
  • Predictive analytics once event history is deep enough
  • Instrumentation wired into the product itself

Data-as-a-Service and analytics retainers

Where analytics stops being a project and becomes an operating capability. Data-as-a-Service is the subscription pathway: we build, run and maintain the ingestion, warehouse and dashboard, you log in and use it, and ongoing maintenance and future roadmap releases are included. It is live in weeks rather than months and you can change tier as your needs move. The alternative Custom Build pathway delivers the identical architecture as an owned asset for a one-off project fee. Both keep your data on your own infrastructure. Reporting that never changes stops being opened, so most clients pair either pathway with a Phase 3 retainer.

  • Data-as-a-Service subscription, live in weeks
  • Custom Build as an owned asset, one-off fee
  • Maintenance and roadmap releases included on DaaS
  • Paired with a Phase 3 retainer for continuous change

Reporting across 100+ gyms.

For Fitstop we built the member app and the franchisee operations portal across 100+ gyms and 50,000+ active members, lifting user retention by more than 10 percent. A franchise network is one of the hardest reporting problems in commercial software, and the difficulty is not volume. It is that the same underlying data has to be presented to three audiences with completely different rights and completely different questions. A franchisee needs their own site in detail, plus enough of the network benchmark to know whether a soft month is their problem or everyone's. Head office needs the network view, comparable across sites, without every franchisee being able to inspect their neighbours. A member needs none of it. Getting that wrong is not merely awkward, it is a commercial and privacy failure, which is why role-based visibility belongs in the data model rather than being bolted onto a dashboard afterwards. The retention improvement is the part worth dwelling on, because retention is not something reporting produces directly. Reporting produces the visibility that lets an operator notice a pattern early enough to act on it - a site whose new-member drop-off has quietly worsened, a class time that has stopped filling. That is the honest case for business intelligence services: not the dashboard, but the decisions it makes possible sooner.

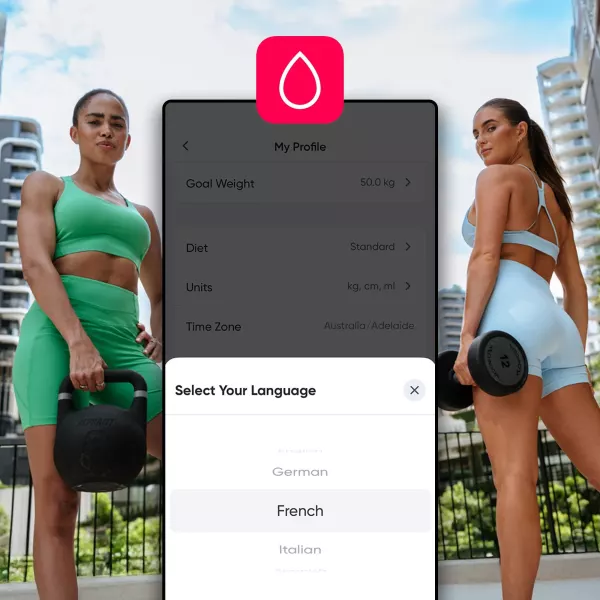
Fitstop member app built by PixelForce Fitstop franchisee operations reporting
Built by PixelForce 100+ gyms · 50,000+ active members

How a data engagement is scoped and priced.

Three engagement models, in the order they normally run. Every figure below is an envelope shaped by scope, never a fixed quote off a rate card - which is exactly why Scoping & Design comes first and why no development quote is issued without it. Data analytics cost is driven by how many sources have to be integrated, how much disagreement exists between them, and how much of the reporting has to be bespoke rather than served by an off-the-shelf tool. A single-source dashboard on clean data sits at the bottom of the range; a multi-source warehouse feeding customer-facing reporting with complex permissions sits considerably higher. Businesses asking what data analytics services cost in Australia should read the two build numbers together, because a credible data platform needs both phases. Third-party warehouse, ingestion and BI licensing sits outside these figures and is billed to you directly by each provider on their own current terms.

Phase 1 · Scoping & Design

$35,000 to $65,000

The mandatory first phase of every data build, and a standalone commitment. Preliminaries and two strategic workshops produce the Business Requirements Document, an inventory of every data source and its real condition, the metrics dictionary that defines each number precisely, the target architecture across ingestion, warehouse, transformation and presentation, a Product Requirements Document, and a fixed-cost Statement of Work for the build. Best for any business with a reporting ambition and no development-ready blueprint. You can stop here if the evidence says stop, and some do. No Blueprint, no Build.

  • Two strategic workshops, priorities locked
  • Source inventory and honest data-condition assessment
  • Metrics dictionary and target architecture
  • BRD, PRD and a fixed-cost SoW for development

Phase 3 · Support and product retainer

From $10,000 per 4 weeks

Where a launched data platform becomes a product. There are two ways to engage after launch. Option 1, Warranty, Monitoring & Support, is $4,000 per month and covers critical-defect warranty, 24/7 infrastructure monitoring, business-hours incident response, notification of required third-party updates with costs stated upfront, and a monthly Platform Health Report - protection without the complexity. Option 2, the Product Retainer, includes everything in Option 1 and adds a roadmap workshop in month one, continuous sprints shipping new reporting into production, and quarterly business reviews. It is priced per four-week cycle against a committed story-point capacity: Steady $10,000, Growth $20,000, Scale $30,000, Velocity $40,000, Momentum $50,000, Enterprise on application. Analytics belongs here more than most disciplines, because a dashboard nobody changes is a dashboard nobody opens.

  • Option 1 - Warranty, Monitoring & Support, $4,000 per month
  • Option 2 - Product Retainer, from $10,000 per four-week cycle
  • Roadmap workshop in month one, then continuous sprints
  • Quarterly business reviews

What goes into analytics that gets trusted.

Six layers that appear in nearly every data platform we build, whatever the tooling. This is the part businesses comparing data analytics companies should look hardest at, because the difference between reporting that gets opened every Monday and reporting that gets abandoned within a quarter lives almost entirely below the visualisation - whether events were captured at all, whether the warehouse holds history the source systems overwrite, whether the transformation logic is tested and reviewable, and whether anybody is told when a pipeline stops running. Every layer below is built to be extended, because the first version of a metrics layer is always partly wrong and the useful question is how quickly it can be corrected.

Sources and ingestion

Everything that produces data, and the connectors that move it. Getting breadth right early matters, because a source added later cannot supply the history you did not collect from it.

  • Backend product database extraction
  • App and website event streams
  • Meta, Google, TikTok, HubSpot and Klaviyo
  • Stitch and Fivetran early, custom pipelines at scale
  • Scheduling, orchestration and retry handling

Warehouse and storage

One place the data lands and is kept, separate from the live application so that reporting queries never compete with your users for resources. This is also where history lives.

  • BigQuery or Snowflake as the warehouse
  • Raw layer preserved before any transformation
  • History retained where source systems overwrite
  • Reporting load isolated from the live product
  • Partitioning and cost control designed in

Transformation and the metrics layer

Where raw tables become agreed numbers. Run in dbt so business logic is organised, tested and version-controlled rather than living in a spreadsheet formula nobody is willing to touch.

  • dbt models with dependencies and templating
  • Automated tests on every transformation
  • Version control and reviewable change history
  • A single agreed definition per metric
  • Idempotent reprocessing of historical periods

Presentation and data visualisation

The layer people actually open, designed around the decision being made rather than around the chart types available. Off-the-shelf or custom, chosen in Phase 1 on the merits.

  • Power BI, Looker or Metabase implementation
  • Custom dashboards embedded in your own product
  • Executive, operational and customer-facing views
  • Scheduled reports and threshold alerting
  • Mobile-readable, not desktop-only

Access, privacy and governance

Who may see which number, and the obligations attached to holding the data at all. Cheapest to build in at the start and most expensive to retrofit once several audiences already have access.

  • Role-based visibility modelled in the data
  • Multi-site and franchise access boundaries
  • Personal data minimisation and retention rules
  • Audit trails on access and on definition changes
  • Hosted on your own cloud account

Monitoring and pipeline reliability

The layer that decides whether the dashboard can be trusted tomorrow. A stale dashboard still looks authoritative, which makes a silent pipeline failure more dangerous than an obvious outage.

  • Freshness checks on every pipeline
  • Alerting before a stakeholder notices
  • Data-quality tests that fail loudly
  • Safe re-runs of any historical period
  • Monthly Platform Health Report under Phase 3

One conversation.
Three phases.
Built to grow.

The same canonical PixelForce engagement model behind 100+ shipped products and $1.5B+ in combined client revenue, applied to your data platform. The 1-3-1 method runs through every conversation - one problem, three options with honest trade-offs across budget, timeline and scope, one recommendation. No Blueprint, no Build.

  1. 0
    Free

    Discovery call

    A free, no-obligation conversation to find the right path for your data platform before you commit a dollar.

    • Mutual NDA signed up front
    • 1-3-1 method: one problem, three options, one recommendation
    • Honest trade-offs across budget, timeline and scope
    • A straight answer on what a credible build looks like
  2. 1
    4-8 weeks

    Scoping & Design

    Everything you need to build with total confidence - a fully costed, designed plan with no scope surprises.

    • Strategic workshops and BRD
    • Full UX/UI design system, every screen built
    • PRD and a fixed-cost Statement of Work
    • No Blueprint, no Build - Phase 1 before any Phase 2 quote
  3. 2
    3-6 months

    Development, QA and Release

    From approved designs to your live data platform, built and tested at a steady sprint cadence.

    • Sprint cadence with regular demos
    • QA across iOS, Android and the edge cases
    • End-to-end App Store and Google Play submission
    • Built to scale from 1,000 to 1,000,000 users
  4. 3
    Ongoing

    Post Launch Support

    We do not disappear at launch - monitoring, warranty, and an optional retainer keep your data platform growing.

    • 24/7 monitoring and a critical-defect warranty
    • Ongoing technical support
    • Optional Product Retainer: four-week sprints and quarterly reviews
    • The model that grew SWEAT to a $400M platform

Data and automation case studies.

Selected data, automation and platform work, built by a 100% in-house Adelaide team you would actually work with on your project. Read these for the decisions rather than the screenshots - which sources were connected and why, what version one deliberately left out, and what the first months of real usage changed. Between them they cover the profiles we see most often on data engagements: an e-commerce operator eliminating a manual export workflow, a marketplace consolidating years of scattered institutional knowledge, and a global consumer app extending its reach across languages and markets.

Data analytics services questions.

The questions businesses ask before committing to a data engagement - what data analytics services actually cover, what they cost in Australia, the difference between business intelligence and data analytics, whether you need a data warehouse yet, what data engineering services build, whether to use Power BI or a custom dashboard, how long a working dashboard takes, who owns the data and the platform, whether reports that will not balance can be fixed, and whether you need to be an existing client. Answers come from building and operating data layers on platforms handling $100M+ in annual bookings and reporting across 100+ gyms. If your question is not here, ask it on a discovery call - that call exists for exactly this.

Data analytics services cover everything between the data your platform already produces and a decision someone can act on. In practice that is four layers. Ingestion moves data out of your product database, your app and website event streams, and third-party sources such as Meta, Google, TikTok, HubSpot and Klaviyo. A warehouse - typically BigQuery or Snowflake - holds it in one place. Transformation, which we run in dbt so the logic is version-controlled, tested and reviewable rather than buried in a spreadsheet, turns raw tables into a defined metrics layer. A business intelligence dashboard then presents those metrics to the people who need them.

The part most providers skip is the metrics layer. Without an agreed definition of what an active user is, or when a subscription counts as churned, two dashboards built off the same warehouse will disagree, and the argument moves from what to do about the number to whose number is right. Defining those metrics is a business exercise, not a technical one, which is why it happens in Phase 1 Scoping & Design alongside the architecture.

Data analytics services in Australia are not sold off a rate card at PixelForce; the cost sits inside the standard engagement envelope and is driven by how many sources are integrated and how much reporting is bespoke.

There is no rate card, because the cost is driven by how many sources have to be integrated, how messy they are, and how much of the reporting has to be bespoke. What we can give you is the envelope, and it is the same structure as every other engagement we run.

Phase 1 Scoping & Design is typically $35,000 to $65,000 and is mandatory before any build. It produces the Business Requirements Document, the metrics definitions, the architecture, a Product Requirements Document and a fixed-cost Statement of Work, so the build number is known before you commit to the build. Phase 2 Development, QA and Release typically runs $100,000 to $350,000 depending on scope. The $350,000 figure is a recommendation rather than a ceiling: with a larger budget we still advise capping version one near it and spending the remainder on iteration once real usage tells you which reports people actually open.

After launch, Phase 3 has two options. Option 1, Warranty, Monitoring & Support, is $4,000 per month and covers critical-defect warranty, 24/7 infrastructure monitoring, business-hours incident response and a monthly Platform Health Report, with technical support capped at seven hours per month. Option 2, the Product Retainer, includes everything in Option 1 and adds a roadmap workshop, continuous sprints and quarterly business reviews, priced per four-week cycle from Steady $10,000 to Momentum $50,000, with Enterprise on application. Most analytics work belongs in Option 2, because a dashboard that never changes stops being used.

Third-party costs sit outside all of that and are billed to you directly by the provider. Warehouse, ingestion and BI licensing all price on their own terms and change regularly, so check the current rates published by BigQuery, Snowflake and Power BI rather than relying on a figure quoted on an agency website.


Business intelligence and data analytics overlap, but the useful distinction is that business intelligence is mostly descriptive, telling you what happened and what is happening now, while data analytics goes further into why it happened and what is likely next.

The two terms overlap enough in marketing copy to be treated as interchangeable, but the distinction is useful when you are deciding what to buy.

Business intelligence services are mostly descriptive. They tell you what happened and what is happening now: revenue this month against last, active users by cohort, which gyms or stores or instructors are performing, where the pipeline sits. The output is a dashboard someone opens on a Monday. Data analytics goes further into why something happened and what is likely to happen next - segmentation, cohort retention analysis, churn signals, forecasting and predictive analytics.

The practical point is that both sit on the same foundation. You cannot do credible predictive work on data that has not been ingested reliably, warehoused consistently and transformed against agreed definitions. Businesses that buy the predictive layer first almost always end up rebuilding the foundation underneath it within a year. We recommend earning the second by getting the first right, and we will say so at the consultation even when the more expensive answer would have been an easier sell.

Frequently a dashboard is enough, and we will tell you that rather than sell you a warehouse you do not need. If all your reporting questions can be answered from one system - your product database, or your e-commerce platform - and the volume is modest, querying that system directly and presenting the result is cheaper, faster and easier to maintain.

A warehouse earns its place when one of three things is true. First, the answer requires joining sources that do not talk to each other, such as product usage against marketing spend against support tickets. Second, reporting queries have started to compete with the live application for resources, which shows up as the app slowing down whenever someone opens a report. Third, you need history that the source systems overwrite, so that a question asked in twelve months about what a cohort looked like at signup can still be answered.

That third point is the one businesses regret ignoring, because the fix is not retrospective. Data you did not capture is simply gone. If you are close to any of these thresholds, capturing to a warehouse early is cheap insurance even if you keep reporting off the source system for now.

Data engineering is the plumbing beneath the reporting, and it is where most of the effort in a data project genuinely goes. Concretely we build the connectors that pull from each source, the scheduling and orchestration that runs them, the schema the warehouse holds, the transformation models in dbt with their tests and dependencies, and the monitoring that tells you when a pipeline has failed before a stakeholder tells you the dashboard looks wrong.

Two engineering properties matter more than anything visual. Idempotent reprocessing means you can safely re-run a pipeline over a period without double-counting, which is what lets you fix a historical bug rather than living with it. Real-time capture at the point an event happens means the record is written when the truth is known, rather than being reconstructed later from whatever state the database happens to be in.

Both of those are exactly what we built into the EzLicence credit ledger. When EzLicence financial reports would not balance, we replaced report-time reconstruction across a dozen unrelated tables with a canonical double-entry credit ledger covering 18 event types, with real-time capture and idempotent reprocessing. Every liability report now draws from one reconcilable source, finance discrepancy complaints stopped, and outstanding credit is aged into time buckets and categorised by source for cash-flow decisions.

PixelForce does both Power BI consulting and custom dashboard development, and which one you get is decided in Phase 1 against your situation rather than assumed, because we are not resold into any BI vendor.

Both, and the choice is made in Phase 1 rather than assumed. We are not resold into any BI vendor, so the recommendation reflects your situation rather than our licensing arrangements.

An off-the-shelf BI tool such as Power BI, Looker or Metabase is usually the right answer when the audience is internal, when your team wants to build and change their own reports without a developer, and when the metrics are standard enough that a general-purpose tool expresses them well. It is faster to stand up and cheaper to maintain, and self-service is a genuine advantage. Check the vendor for current licensing, since per-user and capacity pricing both change.

A custom dashboard is the right answer when the reporting is customer-facing rather than internal, when it must live inside your existing product with your existing authentication and permissions, or when the visualisation is specific enough that a general tool fights you. Franchise and multi-site operators run into this constantly: a franchisee should see their own site and the network benchmark and nothing else, which is a permissions problem a generic BI licence handles awkwardly.

Either way the layers underneath - ingestion, warehouse, transformation, metrics - are identical, which means the presentation layer can change later without rebuilding the foundation.

How long a working dashboard takes depends far more on the state of your data than on the size of the build: weeks where the data is clean and centralised, months where it is scattered or was never captured.

It depends far more on the state of your data than on the size of the build, and we will be able to tell you which situation you are in after the consultation.

Where the data is already clean and lives in one or two systems with sane structure, a first useful dashboard is a matter of weeks. Where the data is spread across several systems that disagree with each other, or where key events were never captured in the first place, the honest answer is months, because the work is not building the dashboard - it is establishing a trustworthy number for it to display.

What we can commit to is sequencing. We do not disappear for a quarter and return with everything. Phase 1 produces the architecture and the metric definitions. The build then delivers in milestones, with the highest-value reports first, so that something is in your hands and being argued about early. Arguing about a real dashboard is the fastest way to discover that a definition everyone agreed to on paper was wrong.

For comparison on delivery pace: we shipped the AI knowledge system for EzLicence, The Handbook, in 4 weeks, and it delivers a 50 percent efficiency gain across workflows while automating 90 percent of documentation updates with 10 percent human oversight.

You own your data on every PixelForce data engagement and it stays on your own cloud infrastructure; who owns the dashboard itself depends on whether you choose the Data-as-a-Service subscription or the Custom Build pathway.

Your data is always yours and it always stays on your own infrastructure. That is not a commercial position adopted for one service line, it applies to every PixelForce engagement, including all data services. Client intellectual property is hosted on the client's own cloud account.

Ownership of the platform itself depends on which pathway you choose, and the two are genuinely different products rather than a good option and a cheap option. Data-as-a-Service is a monthly subscription: we build, run and maintain the ingestion, warehouse and dashboard, and you log in and use it. It goes live in weeks, ongoing maintenance and future roadmap releases are included, and you can change tier as your needs move. It suits businesses who want to prove the value of reporting quickly and treat it as an operating expense.

The Custom Build pathway delivers the same architecture as an owned asset for a one-off project fee. You own the ingestion, warehouse and dashboard outright, with an optional maintenance retainer afterwards. It takes months rather than weeks because it includes Scoping & Design and bespoke development, and it suits businesses that want a long-term data asset on their balance sheet. Intellectual property transfers on full payment.

Yes, PixelForce fixes financial and operational reports that do not balance, and the cause is almost never the report itself: it is a number being reconstructed at report time from tables never designed to be summed together.

Yes, and it is one of the more common reasons a business first calls us about data rather than about an app. The symptom is always the same: two reports that should agree do not, finance stops trusting the numbers, and someone starts maintaining a parallel spreadsheet that becomes the real source of truth.

The cause is almost never the report. It is that the number is being reconstructed at report time by querying several tables that were never designed to be summed together, so the answer depends on the order things happened and on edge cases nobody enumerated. Adding another report on top of that does not help.

The fix is architectural. For EzLicence we replaced report-time reconstruction across a dozen unrelated tables with a canonical double-entry credit ledger covering 18 event types, capturing in real time with idempotent reprocessing. Every liability report now draws from one reconcilable source, the finance discrepancy complaints stopped, and outstanding credit is aged into time buckets and categorised by source so it can inform cash-flow decisions rather than merely be reported. That is what balancing by construction means: the reports agree because they cannot structurally disagree.

No, you do not have to be an existing PixelForce client to use our data analytics services, and we regularly work on platforms we did not write, starting by understanding what is actually there.

No. Data services are listed as a Phase 3 add-on because that is where they most naturally arise - a platform we built goes live, it starts generating meaningful data, and the client wants to see it - but the service does not require us to have built the platform.

We regularly work on systems we did not write. Doing so starts with understanding what is actually there rather than what the documentation claims, which is the same discipline we apply to platform rescue work. Our infrastructure work has cut a client's cloud hosting costs by over 50 percent, saving more than $10,000 every month, and decreased another client's per-user cloud costs by 60 percent - both on systems inherited rather than originally built by us.

Where a platform genuinely cannot support reliable reporting without structural change, we will say so plainly rather than building an analytics layer on a foundation that will undermine it. Declining a project, or recommending against building, is a valid outcome here and we would rather deliver it at the consultation than three months in.

Choose a data analytics company on whether it starts with metric definitions rather than dashboards. Ask how an active user, a churned subscription or a completed order will be defined, who signs those definitions off, and where they are written down.

Then test four things. Ask whether the transformation logic will be version-controlled, tested and reviewable, or buried in a spreadsheet or inside a BI tool nobody can audit. Ask whether the company is resold into a particular BI vendor, because a licensing arrangement is not a recommendation. Ask what happens when two reports disagree, and listen for an architectural answer rather than a promise to check the query. Ask who owns the warehouse, the pipelines and the dashboards afterwards, and whether your data ever leaves your own cloud account.

A good answer will also tell you when you do not need a warehouse at all. If every reporting question can be answered from one system at modest volume, querying that system directly is cheaper and easier to maintain, and a provider willing to say so is telling you something a rate card never will.

Turn your product data into decisions.

Every live platform generates data daily - user behaviour, engagement, churn signals, revenue trends. The question is who structures it, who presents it, and who owns it. Book a free consultation and we will map your current data sources, tell you honestly whether you need a warehouse yet or only better instrumentation, and give you one problem, three options with their trade-offs, and one recommendation across budget, timeline and scope.

  • Top Clutch App Development Company · Australia 2026
  • AWS Advanced Tier Partner · 15+ AWS-accredited engineers
  • 100% in-house development · Adelaide HQ
  • Your data and IP stay on your own cloud account