Dashboard development and analytics that change decisions.

Product analytics and custom dashboards that answer the questions your business actually asks - which cohort retains, where the funnel leaks, what the change did. Instrumented during the build, not bolted on after launch.

  • Events mapped to your commercial model

  • Cohort retention, not vanity totals

  • Custom dashboards your team will open

  • 100% in-house · Adelaide HQ

100+Products and apps shipped
$1.5B+Client revenue facilitated
99.99%Crash-free and uptime
13+ yrsIn-house since 2013

The metrics that actually change a decision.

Which numbers matter depends on how the business makes money. These are the three models we instrument most often, and the measures that genuinely move them.

Subscription products

Activation and cohort retention decide everything. Downloads and registered users feel good and predict nothing. The question worth answering is whether the people who joined in March are still here in May, and what the ones who stayed did differently in their first week. That is a cohort question, and it needs events recorded from launch rather than inferred afterwards.

  • Activation within the first session
  • Cohort retention by week
  • Trial to paid conversion
  • Churn reasons, not just churn rate

Marketplaces and platforms

Liquidity is the metric: what proportion of requests find a match, and how quickly. Behind it sit supply utilisation, time to first transaction and repeat rate. A marketplace can grow both sides and still be failing if the two sides never meet, which is invisible unless you measure the match rather than the signups.

  • Match rate and liquidity
  • Time to first transaction
  • Supply utilisation
  • Repeat rate by cohort

Operations platforms

Where the software is how the work gets done, the metrics are throughput, cycle time and where jobs stall. The value is usually in the queue nobody can see - the step where work sits for two days because one person is a bottleneck. Making that visible is often worth more than any feature on the roadmap.

  • Throughput and cycle time
  • Where work stalls, and for how long
  • Utilisation by team or role
  • Exception and rework rates

The first five minutes, rebuilt from the data.

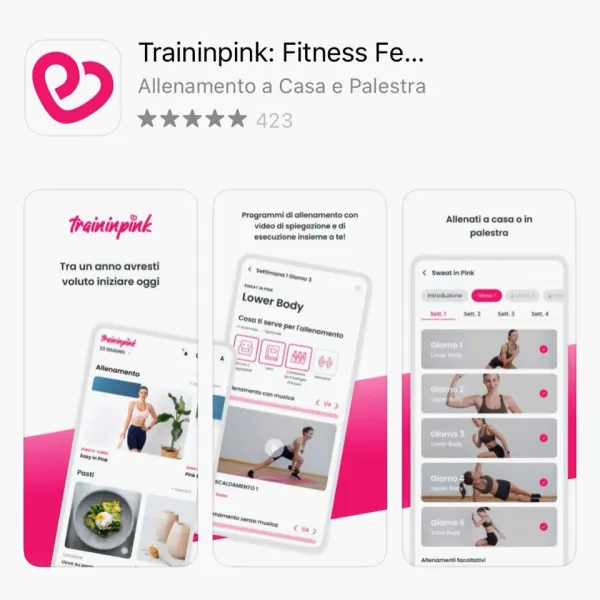
For Traininpink, PixelForce rebuilt the onboarding using the funnel data rather than opinions about what new users wanted. The value of that work was not the redesign - it was knowing precisely which step lost people, so the change was aimed at a real problem instead of a plausible one. That is the whole argument for instrumenting a product properly: without the funnel you are redesigning on instinct, and you cannot tell afterwards whether it worked.

Traininpink onboarding screen Traininpink app screen

Why teams choose us for dashboard development.

Most analytics work fails quietly - the dashboard gets built, then nobody opens it. These are the four things that decide whether it becomes part of how the business runs.

We start from the decision

Not from the data. The first question is which recurring decision you cannot make confidently today, and what would have to be true to make it obvious. Dashboards built from that question get used. Dashboards built from whatever the database happened to contain do not.

  • Decisions mapped before metrics
  • One view per recurring question
  • Ruthless about what is excluded
  • Owner identified for each view

Instrumented during the build

Adding analytics during development costs very little. Adding it afterwards means a release, a wait for data to accumulate, and a permanent gap in your history. We treat event design as part of the build, which is why our dashboards have trustworthy data from launch.

  • Event schema designed up front
  • Consistent naming and properties
  • No inferring behaviour from page views
  • History from day one

We will tell you to use off-the-shelf

Standard analytics tools are excellent at generic product questions and far cheaper than a custom build. Custom dashboards earn their cost when the key metric is specific to your model, when data must be joined across systems, or when the people who need the answer will never log into an analytics tool.

  • Honest build-versus-buy call
  • Existing tools assessed first
  • Custom only where it pays back
  • No Blueprint, no Build

Then we act on it

Measurement is only worth what you change because of it. We run the loop: instrument, find where people actually stop, change that one thing, measure whether it moved. Traininpink is the example - the funnel data pointed at the first five minutes, so that is what got rebuilt.

  • Instrument, change, measure
  • One change at a time
  • Result reported honestly
  • Four-week iteration cycles

Our analytics and dashboard services.

From deciding what to measure through to the views your team opens every Monday.

Metric definition

Working out which small set of numbers actually reflects how the business makes money, and agreeing precise definitions so two people cannot compute the same metric differently.

  • Commercial model mapped
  • Metric definitions documented
  • Vanity measures excluded
  • Owners agreed per metric

Product instrumentation

Designing and implementing the event schema so the data is trustworthy and consistent, whether the product is new or already live.

  • Event schema design
  • Mobile and web implementation
  • Retrofitting existing products
  • Validation and QA of events

Custom dashboards

Building the views themselves, designed so the next decision is obvious rather than requiring interpretation. Delivered where the audience already works.

  • Role-specific views
  • Designed for scanning, not study
  • Scheduled reporting
  • Access control per audience

Data pipelines

Joining data that lives across several systems into one trustworthy model, with the reconciliation and alerting that keeps it honest over time.

  • Multi-source data joins
  • Scheduled and streaming loads
  • Reconciliation checks
  • Alerting on pipeline failure

Funnel and cohort analysis

Finding where people stop and which cohorts behave differently, then turning that into a short prioritised list of changes worth making.

  • Funnel drop-off analysis
  • Cohort retention curves
  • Segment comparison
  • Prioritised recommendations

Ongoing measurement

A retainer that runs the instrument-change-measure loop continuously rather than treating analytics as a project that finished.

  • Four-week planning cycles
  • Experiment design and readout
  • Dashboard maintenance
  • New events as the product grows

Independent recognition for the team behind this work.

Apple Best of Developers, Watch and TV App of the Year, ACS Digital Disruptor Gold, and Top Clutch App Development Company in Australia. The kind of recognition you cannot buy with a marketing budget - earned by shipping software people use every day.

Apple Watch App of the Year
Clutch Top User Experience Company
Apple TV App of the Year
Apple Best of Developers
Clutch Top App Development Company
Australian Technology Services Achiever
Web Excellence Awards (Website)
Web Excellence Awards (App)
ACS Digital Disruptor Gold Award

One conversation.
Three phases.
Built to grow.

The same canonical PixelForce engagement model behind 100+ shipped products and $1.5B+ in combined client revenue, applied to your analytics platform. The 1-3-1 method runs through every conversation - one problem, three options with honest trade-offs across budget, timeline and scope, one recommendation. No Blueprint, no Build.

  1. 0
    Free

    Discovery call

    A free, no-obligation conversation to find the right path for your analytics platform before you commit a dollar.

    • Mutual NDA signed up front
    • 1-3-1 method: one problem, three options, one recommendation
    • Honest trade-offs across budget, timeline and scope
    • A straight answer on what a credible build looks like
  2. 1
    4-8 weeks

    Scoping & Design

    Everything you need to build with total confidence - a fully costed, designed plan with no scope surprises.

    • Strategic workshops and BRD
    • Full UX/UI design system, every screen built
    • PRD and a fixed-cost Statement of Work
    • No Blueprint, no Build - Phase 1 before any Phase 2 quote
  3. 2
    3-6 months

    Development, QA and Release

    From approved designs to your live analytics platform, built and tested at a steady sprint cadence.

    • Sprint cadence with regular demos
    • QA across iOS, Android and the edge cases
    • End-to-end App Store and Google Play submission
    • Built to scale from 1,000 to 1,000,000 users
  4. 3
    Ongoing

    Post Launch Support

    We do not disappear at launch - monitoring, warranty, and an optional retainer keep your analytics platform growing.

    • 24/7 monitoring and a critical-defect warranty
    • Ongoing technical support
    • Optional Product Retainer: four-week sprints and quarterly reviews
    • The model that grew SWEAT to a $400M platform

Metrics that Matter work we have shipped.

Selected work from PixelForce - built by the same in-house team you would be working with.

Frequently asked.

Metrics that Matter questions from founders, operators and product leads.

Dashboard development is building the reporting layer your team actually uses to run the business - the small number of views that answer recurring questions, rather than a wall of charts nobody opens. It covers deciding which metrics matter, instrumenting the product so those metrics are trustworthy, modelling the data, and designing views that make the next decision obvious.

Often you should, and we will say so. Off-the-shelf analytics is excellent at generic product questions. Custom dashboards earn their cost when your key metric is specific to your commercial model, when the data lives across several systems that need joining, or when the people who need the answer will not log into an analytics tool. The honest test is whether anyone would open it weekly.

Deciding which events correspond to real commercial moments and recording them consistently from day one, rather than inferring behaviour from page views later. Done during the build it is cheap. Done afterwards it means a release, a wait for data to accumulate, and a gap in your history. This is why we treat analytics as part of the build rather than a phase after it.

Yes, and it is some of the highest-return work we do. For Traininpink we rebuilt the first five minutes of the app using the funnel data rather than opinions about what new users wanted. The pattern is consistent: instrument, find where people actually stop, change that one thing, and measure whether it moved.

The ones tied to how the business makes money, which differ by model. A subscription product lives on activation and cohort retention. A marketplace lives on liquidity and repeat rate. A services platform lives on completion and utilisation. Vanity totals - downloads, page views, registered users - feel good and change nothing. We settle the metric set during Scoping and Design.

Instrumenting an existing product and standing up a first dashboard is typically weeks rather than months, because the work is mostly deciding what to measure. Building custom analytics into a new product costs very little extra when it is designed in from the start, which is the argument for doing it then rather than later.

Let us build your dashboard.

Tell us which decision you cannot make today because the data is not there. We will come back with three options, honest trade-offs across budget, timeline and scope, and one clear recommendation.

  • Top Clutch App Development Company · Australia
  • 100% in-house · Adelaide HQ
  • 100+ products and $1.5B+ client revenue
  • Free consultation · NDA on request